A streamlined and efficient development environment is crucial for dealing with the increasing complexity of modern hardware designs. However, that is not always the case when it comes to hardware description languages (HDLs). For instance, if you are used to coding with popular programming languages like Python or C++ on a modern editor like VSCode, you may feel like RTL design tools are far behind in development experience.
In this post, I will share a VSCode setup that may help you improve your experience. The setup focuses specifically on SystemVerilog, using VSCode Dev Containers and a few popular open-source lightweight tools for SystemVerilog development. You will use VSCode’s text editor and integrated terminal to run commands for simulating and verifying designs and visualizing waveforms, all from within VSCode.
Importantly, the environment discussed in this post does not require downloading any heavy software or dealing with licenses, and it should work out of the box wherever you are, whether you are using a Mac, Linux, or Windows machine, on your personal laptop, or office workstation. With this flexibility, I hope you can spend more time on what matters most: designing and verifying your hardware.
Whether you’re a seasoned FPGA/ASIC engineer or just starting with digital design, this post may help you improve your workflow. So, let’s dive into the world of SystemVerilog development with VSCode Dev Containers and unlock the full potential of your projects.
Also, if you use a similar setup and have pro tips to share, please let us know in the comments below. It would be nice to learn from your experiences as well!
Overview
This post explores the following open-source tools integrated into the VSCode Dev Container:
- VSCode Verilog-HDL/SystemVerilog/Bluespec SystemVerilog Extension.
- Icarus Verilog.
- Verilator.
- Verible.
- GTKWave.
- cocotb.
Icarus Verilog is used for simulation, Verilator for linting, Verible for formatting and language server, GTKWave for waveform visualization, and cocotb for verification. Meanwhile, the VSCode Verilog-HDL/SystemVerilog/Bluespec SystemVerilog Extension provides syntax highlighting, code completion, and other useful features for SystemVerilog development, using Verible and Verilator on the backend.
Note: These tools are licensed under the GNU LGPL-3.0, Apache 2.0, GNU GPL-2.0, and BSD-3-Clause licenses. Please refer to the respective projects for more information.
VSCode Dev Containers Overview
If you are new to Docker and VSCode Dev Containers, a container resembles a virtual machine (VM). However, unlike a VM, a container does not require an entire operating system to run. Instead, it runs on the host machine’s operating system, sharing the same kernel. This makes containers lightweight and fast to start and stop.
One of the advantages of containers is that they are reproducible, and loads of images are available on the Docker Hub platform. For instance, you can find images for popular Linux distributions like Ubuntu. Then, all you need to do is run the image with a command like docker run -it ubuntu:jammy to download and start running a Ubuntu 22.04 container. After that, you can install tools and dependencies on the container, and they will be isolated from your host machine.
VSCode makes developing inside a containerized environment easy with the so-called VSCode Dev Containers. A Dev Container is a Docker container on which VSCode runs if configured to do so. Then, any tools available on the container are also available on VSCode.
With Dev Containers, you can isolate your development environment from your host machine, which is particularly useful when installing tools and dependencies that may conflict with other projects on your host machine. Also, you can create a consistent and reproducible development environment that works across different devices and operating systems. For instance, you can develop on a Mac (including Apple Silicon) while running VSCode on a Linux container.
Dev Container Setup
The first step is to install VSCode and the Remote Development Extension Pack. This extension pack provides the necessary tools to develop inside a containerized environment. Also, if you are not using Docker yet, please install it by following the instructions on Docker’s website.
Next, start a project on VSCode and create a .devcontainer directory on it with a file named devcontainer.json. The latter contains the configuration for the development environment. Add the following contents to the .devcontainer/devcontainer.json file:
{
    "name": "SystemVerilog Dev",
    "image": "ubuntu:jammy",
    "runArgs": [
      "--name",
      "systemverilog-dev"
    ],
    "remoteEnv": {
      "LANG": "C.UTF-8"
    },
    "postCreateCommand": "./.devcontainer/post-create.sh",
    "customizations": {
      "vscode": {
        "extensions": [
          "mshr-h.veriloghdl",
          "ms-python.python"
        ]
      }
    }
}
Note the following:
- The
imagefield specifies the base image for the container. In this case, we use Ubuntu Jammy. - The
runArgsfield specifies the arguments to pass to thedocker runcommand. In this case, we use the--nameargument to name the containersystemverilog-dev. You can choose any name you want. I just find it useful to name containers so that you can easily locate them when running a command likedocker ps. - The
remoteEnvfield specifies the environment variables to set in the container. In this case, we set theLANGvariable toC.UTF-8. This is useful to avoid locale issues when opening a terminal window directly on VSCode inside the dev container. For more information, see theterminal.integrated.detectLocaleoption. - The
postCreateCommandfield specifies a script to run after the container is created. In this case, we use a script to install the necessary tools for SystemVerilog development. We will explore this script momentarily. - The VSCode extensions specified in the
customizations.vscode.extensionsfield are installed in the container. In this case, we install the VSCode Verilog-HDL/SystemVerilog/Bluespec SystemVerilog and Python extensions. You may want to install other extensions you like by adding them to the list.
Next, create the post-create script referenced in the devcontainer.json file. Create a file named post-create.sh in the .devcontainer directory with the following contents:
#!/bin/bash
set -xe

apt update
DEBIAN_FRONTEND=noninteractive apt install -y \
    curl \
    dbus-x11 \
    git \
    gtkwave \
    iverilog \
    jq \
    python3-pip \
    universal-ctags \
    verilator \
    wget
pip3 install \
    cocotb \
    cocotb-test \
    flake8 \
    isort \
    pytest \
    yapf

# Verible
ARCH=$(uname -m)
if [[ $ARCH == "aarch64" ]]; then
    ARCH="arm64"
fi
DIST_ID=$(grep DISTRIB_ID /etc/lsb-release | cut -d'=' -f2)
DIST_RELEASE=$(grep RELEASE /etc/lsb-release | cut -d'=' -f2)
DIST_CODENAME=$(grep CODENAME /etc/lsb-release | cut -d'=' -f2)
VERIBLE_RELEASE=$(curl -s -X GET https://api.github.com/repos/chipsalliance/verible/releases/latest | jq -r '.tag_name')
VERIBLE_TAR=verible-$VERIBLE_RELEASE-linux-static-$ARCH.tar.gz
if [[ ! -f $VERIBLE_TAR ]]; then
    wget https://github.com/chipsalliance/verible/releases/download/$VERIBLE_RELEASE/$VERIBLE_TAR
fi
if [[ ! -f "/usr/local/bin/verible-verilog-format" ]]; then
    tar -C /usr/local --strip-components 1 -xf $VERIBLE_TAR
fi
rm $VERIBLE_TAR
Note the script installs the tools mentioned previously: Verilator, Icarus Verilog, GTKWave, and cocotb. These are installed directly from binary packages available in the Ubuntu apt repositories and PyPI. The script also installs Verible directly from statically-linked binaries available on the project’s GitHub repository. Furthermore, the script installs flake8, yapf, and pytest for Python linting, formatting, and testing, respectively. These are used when editing Python-based cocotb testbenches.
Finally, reopen the project in a container by clicking the green button on the bottom left corner of VSCode and selecting Remote-Containers: Reopen in Container. This will create a container based on the configuration in the devcontainer.json file.
Once the container is launched, the left corner of the VSCode status bar should display Dev Container: SystemVerilog Dev. Then, you can open a terminal window on VSCode and make sure the tools are installed. For example, run the following commands:
verilator --versioniverilog -vgtkwave --versioncocotb-config --versionverible-verilog-format --versionIf all the tools are installed correctly, you should see the version numbers for each of them. The instructions in this post are based on the following versions:
- Verilator 4.038 2020-07-11 rev v4.036-114-g0cd4a57ad.
- Icarus Verilog version 11.0 (stable).
- GTKWave Analyzer v3.3.104.
- cocotb version 1.7.2.
- Verible v0.0-3303-gd87f2420.
VSCode Extensions
Next, let’s explore the VSCode Verilog-HDL/SystemVerilog/Bluespec SystemVerilog Extension. This extension provides syntax highlighting, code completion, navigation, and linting for Verilog, SystemVerilog, and Bluespec SystemVerilog. In the context of this post, we are interested in its SystemVerilog support.
To configure it, create and edit a VSCode workspace settings file. That is, create a file named settings.json on the .vscode directory with the following contents:
{
    "editor.formatOnSave": true,
    "verilog.linting.linter": "verilator",
    "verilog.languageServer.veribleVerilogLs.enabled": true,
    "verilog.formatting.verilogHDL.formatter": "verible-verilog-format",
    "verilog.ctags.path": "/usr/bin/ctags",
    "python.formatting.provider": "yapf",
    "python.linting.flake8Enabled": true,
    "python.linting.enabled": true,
}
Note the following:
- The
editor.formatOnSaveoption enables automatic code formatting when saving a file. This is useful to keep the code formatted consistently. - The
verilog.linting.linteroption specifies the linter to use. In this case, we use Verilator. This is useful for catching common errors in the code. Alternatively, this option could be set to Icarus Verilog (iverilog). Feel free to try both and see which one you like better. While this post uses Icarus Verilog for simulation, Verilator is only used for linting and is not further discussed. - The
verilog.languageServer.veribleVerilogLs.enabledoption enables the Verible Verilog Language Server. This is useful to provide code completion and other features using the Language Server Protocol (LSP) under the hood. - The
verilog.formatting.verilogHDL.formatteroption specifies the code formatter to use. In this case, we use the Verible Verilog formatter. - The
verilog.ctags.pathoption specifies the path to the ctags executable from the Universal Ctags project, which enables easy code navigation. - The
python.formatting.provideroption specifies the Python code formatter to use. In this case, we use yapf. Thepython.linting.flake8Enabledandpython.linting.enabledoptions enable Python linting using flake8. Please feel free to use your favorite Python formatter and linter.
With that, we are ready to explore an example SystemVerilog design.
Example SystemVerilog Design
To start, let’s define a straightforward example project to explore the tools of interest. Create a file named counter.sv with the following contents:
module counter #(
    parameter int N = 8
) (
    input logic clk,
    input logic rst,
    input logic en,
    output logic [N-1:0] count
);

  always_ff @(posedge clk, posedge rst) begin
    if (rst) count <= 0;
    else if (en) count <= count + 1;
  end

endmodule
The design is a very simple N-bit up counter with an asynchronous reset and a synchronous enable signal. It should only count when en is high, and it should reset the count when the asynchronous rst signal rises.
Next, create a testbench to exercise this behavior. Create a file named counter_tb.sv with the following contents:
`timescale 1ns / 1ps

module counter_tb;

  localparam int N = 8;  // counter bit width
  localparam int T = 10;  // clock period in ns

  logic clk;
  logic rst;
  logic en;
  logic [N-1:0] count;

  counter #(
      .N(N)
  ) uut (
      .clk(clk),
      .rst(rst),
      .en(en),
      .count(count)
  );

  // Clock
  always begin
    clk = 1'b1;
    #(T / 2);
    clk = 1'b0;
    #(T / 2);
  end

  // Async reset (over the first half cycle)
  initial begin
    rst = 1'b1;
    #(T / 2);
    rst = 1'b0;
  end

  // Enable on the third cycle and count for 10 cycles
  initial begin
    en = 0;
    repeat (3) @(negedge clk);
    en = 1;
    #(10 * T) $finish;
  end

  initial begin
    $timeformat(-9, 1, " ns", 8);
    $monitor("time=%t clk=%b rst=%b en=%b count=%2d", $time, clk, rst, en, count);
    $dumpfile("counter_tb.vcd");
    $dumpvars(0, counter_tb);
  end

endmodule  // counter_tb
Note: the counter instantiation on the testbench can be helped by the Verilog extension. Run
ctrl+P(orcmd+Pon Mac) and type>Verilog: Instantiate Module, then select thecountermodule. This will create the instantiation for you.
To ensure the ctags option is working as expected, try right-clicking on a symbol like counter in the testbench and select Go to Definition. This should take you to the definition of the counter module in the counter.sv file. If that is not working, you can troubleshoot the ctags generation by looking at the Output panel (View > Output) on the Verilog channel. Every time you save an .sv file, you should see a log like [CtagsManager] [Ctags] Executing Command: /usr/bin/ctags.
Simulation Using Icarus Verilog
Next, we can simulate the design using Icarus Verilog directly from VSCode. Open the integrated terminal with Ctrl+Shift+T or Cmd+Shift+T (or View > Terminal from the menu). Then, compile the design and testbench using the following command:
iverilog -g2012 -o counter_tb counter.sv counter_tb.svNote the -o flag specifies the name of the output file, while the -g2012 flag specifies the SystemVerilog standard to use (IEEE1800-2012). Also, the compilation needs both the design and testbench files. The result is a binary file named counter_tb that can be executed to run the simulation.
Next, run the simulation using the vvp program (Icarus Verilog simulation runtime engine) as follows:
vvp counter_tbYou should see the simulation output in the terminal window. In particular, note the $monitor statement in the testbench prints the value of the clk, rst, en, and count signals as they change. For instance, you should see the en signal changing to 1 at 25 ns and the count signal changing to 1 at 30 ns.
Waveform Visualization Using GTKWave
The example testbench also includes $dumpfile and $dumpvars statements to dump the value of all signals at the end of the simulation into a VCD (value change dump) file named counter_tb.vcd. Then, you can use GTKWave (or any other VCD viewer) to open the VCD file and visualize the simulation waveforms as follows:
gtkwave counter_tb.vcdNote
gtkwaveopens a graphical user interface from the container. Since the container does not have a display, you need to install an X11 server on your local machine (the container host) to display the GUI. For example, on macOS, you can install XQuartz and runxhost +on a host terminal to allow connections from the container to the host’s X11 server. For more information, see this article.
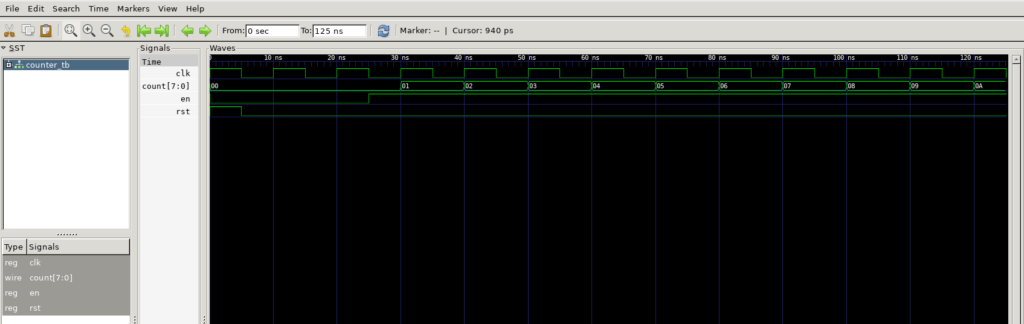
Inside GTKWave, you can add signals to the waveform viewer by clicking the + button on the top left corner of the window. Select the counter_tb module and add the clk, rst, en, and count signals. Then, click on the Zoom Fit button to see the entire simulation. The result should look like the following:
Note other extensions can allow you to open VCD waveform files directly on VSCode. For example, that is the case of the WaveTrace extension, which has limited support under the free version. Also, the TerosHDL extension has a built-in waveform viewer based on the VCDRom project. Please feel free to explore such extensions and tools.
Automation Using Makefile and VSCode Tasks
The previous manual terminal commands are not very convenient when the design grows in complexity. Typically, you want to manage the compilation and simulation steps using a build automation tool like GNU Make. So, next, let’s define an example Makefile. Create a file named Makefile with the following contents:
all: counter_tb

.PHONY: vvp waveform clean

counter_tb: counter.sv counter_tb.sv
    iverilog -g2012 -o counter_tb counter.sv counter_tb.sv

counter_tb.vcd: counter_tb
    vvp counter_tb

vvp: counter_tb.vcd

waveform: counter_tb.vcd
    gtkwave counter_tb.vcd

clean::
    rm -f counter_tb counter_tb.vcd
Note that, as usual, the rules depend on each other. For example, by running make waveform, you will compile the design and testbench, run the simulation, and open the generated VCD file with the waveform viewer.
After that, you can integrate these steps into VSCode tasks. Create a file named tasks.json on the .vscode folder with the following contents:
{
    "version": "2.0.0",
    "tasks": [
        {
            "label": "Build",
            "type": "shell",
            "command": "make -C ${fileDirname}",
            "group": {
                "kind": "build",
                "isDefault": true
            },
            "problemMatcher": []
        },
        {
            "label": "Simulate",
            "type": "shell",
            "command": "make -C ${fileDirname} vvp",
            "problemMatcher": []
        },
        {
            "label": "View Waveform",
            "type": "shell",
            "command": "make -C ${fileDirname} waveform",
            "problemMatcher": []
        },
        {
            "label": "Clean",
            "type": "shell",
            "command": "make -C ${fileDirname} clean",
            "problemMatcher": []
        }
    ]
}
With that, it becomes easier to build and simulate a design. While editing the counter.sv or counter_tb.sv files, press Ctrl+Shift+B (or Cmd+Shift+B on macOS) to build the design. Alternatively, press Ctrl+Shift+P (or Cmd+Shift+P on macOS), type Tasks: Run Task, and select the task. For instance, select the View Waveform task to run the simulation and open the generated VCD file on GTKWave.
Verification Using cocotb
Next, let’s explore how to use cocotb in the VSCode environment. If you are new to it, cocotb is a framework for verifying RTL designs using Python testbenches. It is a powerful tool that allows you to write testbenches in Python and use Python libraries to generate stimulus and check the design outputs. If you are used to writing Python code, you may find cocotb more convenient than writing tests in SystemVerilog.
The following Python code reproduces the SystemVerilog testbench presented earlier:
import cocotb
from cocotb.clock import Clock
from cocotb.triggers import FallingEdge, Timer

async def gen_reset_and_enable(dut, period_ns):
    # - Leave the async reset high over the first half cycle.
    # - Enable the counter on the third cycle.
    dut.rst.value = 1
    dut.en.value = 0
    await Timer(period_ns / 2, units="ns")
    dut.rst.value = 0
    await Timer(2 * period_ns, units="ns")
    dut.en.value = 1

@cocotb.test()
async def counter_test(dut):
    clk_period_ns = 10
    cocotb.start_soon(Clock(dut.clk, clk_period_ns, units="ns").start())
    cocotb.start_soon(gen_reset_and_enable(dut, clk_period_ns))

    # Count for 10 cycles after the enable.
    expected_count = 0
    while expected_count <= 10:
        await FallingEdge(dut.clk)
        dut._log.info("rst=%d en=%d count=%d", dut.rst.value, dut.en.value,
                      dut.count.value)
        if dut.en.value == 1:
            assert dut.count.value == expected_count
            expected_count += 1
Note cocotb is based on asynchronous programming and coroutines. If you are unfamiliar with these concepts, you may want to read about them first. For example, if you have a background in Python programming and concepts such as generators, you may find it helpful to understand how async/await works in detail. For brevity, we will not cover those concepts in this tutorial. Instead, we will focus on the VSCode integration.
For what follows, it suffices to understand that:
- The
Clockobject started by thecocotb.start_sooncall generates the clock signal with a period of 10 ns. - The
gen_reset_and_enablefunction generates the reset and enable signals. It is a coroutine that uses theTimertrigger to wait for a given amount of time. Like the SystemVerilog testbench, it leaves the reset high for the first half cycle and enables the counter on the third cycle at 25 ns. - The while loop waits for the counter to count from 0 to 10. It uses the
FallingEdgetrigger to wait for the clock falling edge. It also uses theassertstatement to check if the counter value is equal to the expected value.
Next, let’s run the cocotb testbench. There are a few ways to do that, and we explore some in the sequel. First, based on the project documentation, you can create a standalone Makefile to run the cocotb testbench. Since we already have a file named Makefile, create a separate file named cocotb.mk with the following contents:
SIM ?= icarus
TOPLEVEL_LANG ?= verilog
VERILOG_SOURCES += $(PWD)/counter.sv
TOPLEVEL = counter
MODULE = counter_tb
include $(shell cocotb-config --makefiles)/Makefile.sim
Then, run it on the terminal
make -f cocotb.mkYou should see the test results with logs produced by the dut._log.info call on the example code.
Note the above cocotb.mk file calls include to include the cocotb Makefile.sim file, whose path is returned by the cocotb-config --makefiles shell command. Then, the entire content of the Makefile comes from the included sources. Of course, this is convenient and easy to use, but it may not be the best when the goal is to integrate cocotb into an existing Makefile. Also, it does not tell much about how the test is executed under the hood.
So, instead, you may prefer to integrate the cocotb testbench into the Makefile presented earlier. To do so, you can add the following rules to it:
COCOTB_BUILD_DIR := build

$(COCOTB_BUILD_DIR)/%.vvp: %.sv
	mkdir -p $(COCOTB_BUILD_DIR)
	echo -n "+timescale+1ns/1ps\n" > $(COCOTB_BUILD_DIR)/cmds.f
	iverilog -g2012 -f $(COCOTB_BUILD_DIR)/cmds.f -o $@ $<

cocotb: $(COCOTB_BUILD_DIR)/counter.vvp
	MODULE=counter_tb TOPLEVEL=counter TOPLEVEL_LANG=verilog \
	vvp \
	-M $(shell cocotb-config --lib-dir) \
	-m $(shell cocotb-config --lib-name vpi icarus) \
	$(COCOTB_BUILD_DIR)/counter.vvp

.PHONY: cocotb

clean::
	rm -r $(COCOTB_BUILD_DIR)
Note that:
- The rules execute the same Icarus Verilog commands discussed earlier:
iverilogandvvp. The difference is that the compilation viaiverilognow compiles the source modulecounter.svinstead of the SystemVerilog testbench (counter_tv.sv). Also, the compilation rule generates and includes acmdfile(namedcmds.f) defining the testbench’s timescale. - The
vvpcommand loads the cocotb VPI module for Icarus Verilog, whose path and name are returned by thecocotb-configcommands. It also defines theMODULEandTOPLEVELvariables used by cocotb to find the Python testbench and the top-level SystemVerilog module under test, respectively. TheTOPLEVELmodule is injected by cocotb as thedutobject into the test function decorated with@cocotb.test()(i.e.,counter_testin our example). - The compiled vvp file is generated on a separate directory defined by the
COCOTB_BUILD_DIRvariable. - The
clean::rule extends the previously definedcleanrule to remove the cocotb build directory.
With that, you can run the cocotb testbench from the terminal:
make cocotbBesides, note it is the VPI module that loads the Python testbench and executes it, as you can see from logs like Found test counter_tb.counter_test. The vvp engine loads the VPI module, which in turn loads the Python testbench. Hence, with this configuration, you cannot run the testbench directly by running the Python file (counter_tb.py). An alternative for that is presented next.
Testbench Integration on VSCode’s Test Explorer
Lastly, if you are used to developing Python projects on VSCode, you may be used to the convenience of having unit tests on the Test Explorer. Fortunately, you can also have that for cocotb testbenches. To do so, we use the cocotb-test Python package installed in the beginning by the post-create.sh script.
First, create a Python script named test_runner.py with the following contents:
import os

from cocotb_test.simulator import run

def test_counter():
    src_dir = os.path.dirname(__file__)
    run(
        verilog_sources=[os.path.join(src_dir, "counter.sv")],
        toplevel="counter",
        module="counter_tb",  # name of cocotb test module
        timescale="1ns/1ps")
The sole purpose of this script is to launch the counter_tb testbench directly from a Python function instead of using a Makefile. With that, it becomes possible to run the testbench directly from pytest, which you can confirm by running the following on the terminal:
pytest test_runner.pyThen, you can integrate pytest on the Test Explorer. To do so, add the following to your .vscode/settings.json file:
    "python.testing.pytestArgs": [
        "."
    ],
    "python.testing.unittestEnabled": false,
    "python.testing.pytestEnabled": true
Note the pytestArgs setting tells pytest to search for tests starting from the project’s root directory.
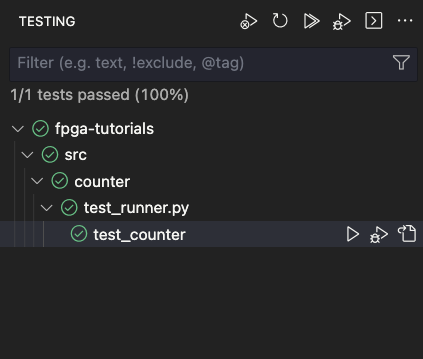
Finally, switch to the Test Explorer (View > Testing) and click on the refresh button. You should see the test_counter test case on the list. You can run it by clicking on the play button as follows:
Conclusions
This concludes this tutorial. We have only scratched the surface of what is possible with the discussed tools and VSCode. Hopefully, after reading it, you can now set up a productive environment to develop and test your SystemVerilog designs on VSCode. If you have any questions or suggestions, please feel free to contact me or leave a comment in the comment section below.
Leave a Reply